
The Q1 Debrief
A framework for Q2 and beyond — what to own, what to avoid, and the three conditions that signal when everything changes.

The Long & Short | Free Article | Good Friday, April 3, 2026
A note before you read: This article reflects how I’m thinking about longer-term portfolio positioning heading into Q2 and beyond. The ETFs I reference are the most liquid expressions of each thesis — illustrations of exposure, not personalized recommendations. Your specific situation, tax considerations, risk tolerance, and available investment options are yours to evaluate. Think of this as a framework for how to think, not a prescription for what to do. Some of you have full brokerage flexibility. Some of you are working within a 401k menu of twelve funds. Both of you can use this.
Oil nearly doubled in a single quarter.
WTI crude opened January 2 at $55.85. It closed April 2 at $111.40. That move — in three months, in one of the most widely traded commodities on earth — is the most important financial fact of 2026. Everything else that happened in Q1 is downstream of that number.
SPX fell 4.3% over the same period, closing at 6,582 from a January 2 open of 6,878. The Mag7 fell an average of 24.7% from their peaks. The bond market experienced more stress than at any point since SVB. And this morning — on Good Friday, while every exchange sits dark — the March jobs report dropped: +178,000 jobs vs. a +65,000 estimate, unemployment at 4.3% vs. 4.4% expected. The prior February reading was simultaneously revised to −92,000. Markets cannot react until Monday. On Liberation Day’s one-year anniversary, two executive orders also landed that added a demand shock on top of a supply shock that was already rewriting the macro playbook.
I want to walk you through how I’m thinking about what happened and — more importantly — where I think money should be positioned for the next 6-12 months. This is the work I do every day for households. I’m sharing the framework publicly because I think it’s the most useful thing I can offer right now.
What Actually Happened in Q1
The Mag7 broke before Iran did.
The mainstream story is that the tech selloff was caused by the war. The timing doesn’t support that. Microsoft reported earnings on January 28. Azure growth came in “in-line” — not bad, not great. For a stock priced for AI dominance, in-line was a verdict. Then Google reported $91.4 billion in 2025 capex with guidance toward $175-185 billion in 2026. Then Amazon confirmed $131.8 billion in 2025 capex with $200 billion projected. The market asked one question — what is the return on all this spending — and got no satisfying answer.
Six of seven Mag7 names entered bear market territory before the first shot was fired on February 28. Iran accelerated a correction that was already in motion.
Here’s the structural context I keep coming back to: the AI mega-caps currently represent approximately 40% of S&P 500 market cap. Technology peaked at 41% in 2000. The Nifty Fifty peaked at 40% in 1972. Railroads peaked at 63% in 1881. Each concentration peak was followed by a multi-year period where the concentrated sector underperformed while new leadership emerged. I’m not predicting tech goes to zero. I’m saying the leadership cycle is rotating — and that the assets that lead the next several years are different from the ones that led the last several years.
The oil move is not what most people think it is.
WTI went from $55.85 to $112. That’s a 100% increase. But here’s what I think most investors are missing: the inflationary impact of that move has barely started.
It takes 6-9 months for an energy supply shock to work its way through into core CPI and PCE. The physical shock hit in late February. That means the inflationary bleedthrough into the prices you actually pay — groceries, transportation, manufacturing inputs, everything downstream of petrochemicals — runs August through December 2026 at minimum.
This morning’s +178,000 NFP print makes this more complicated, not simpler. A labor market that just beat estimates by nearly 3x gives the Fed zero cover to cut rates — regardless of what oil is doing to growth. Strong jobs plus supply-driven inflation plus no Fed relief is the definition of stagflation lock. The February revision to −92,000 tells you the underlying trend was worse than reported. The three-month average is still deteriorating. But the headline number eliminates any near-term Fed pivot narrative. Both tails just got more extreme simultaneously.
We are in the early innings of the inflation story. Not the late innings. The second and third-order effects haven’t started yet.
April 2 added a second shock of a different type.
On the one-year anniversary of the original Liberation Day, two executive orders were signed. Pharmaceutical tariffs under Section 232 — 100% tariffs on patented drugs and active pharmaceutical ingredients from most countries, phased in July through September 2026. And a metals enforcement change — steel, aluminum, and copper tariffs stay at 50%, but calculated on actual US spot prices rather than declared import values starting Monday.
Here’s why this matters structurally: the Iran shock is a supply shock. It reduces the amount of oil available and drives prices up. Tariffs are a demand shock — they raise the cost of imported goods and reduce real purchasing power. Supply shocks are inflationary. Demand shocks are deflationary. Together they produce the outcome that is hardest to navigate: stagflation. Higher prices and weaker growth simultaneously.
This is the 1970s combination. And the 1970s data tells us something important — the equity market was slow to understand it. Prices fell while earnings estimates kept rising. Companies hadn’t reported yet. Analysts were still using pre-war, pre-tariff models.
Q1 earnings season starts in two weeks. That’s the forcing function where the market’s expectations finally confront the physical reality.
What the Positioning Data Is Telling Me
I track positioning data carefully — not because I think it predicts the future, but because maximum positioning extremes in one direction tend to mean the move in that direction is mostly over, and the risk of a reversal is higher.
Here’s what stands out heading into Q2:
Hedge fund gross leverage — the total amount of both long and short exposure relative to capital — is at a 5-year extreme. The highest reading in five years, going into Liberation Day tariffs. And the key detail: the selling we saw in March was mostly short-adding, not long-reducing. Funds added hedges without reducing their core long exposure. The gross book is still fully deployed.
What this means to me: the real forced selling hasn’t happened yet. When it comes — and I think it comes in Q1 earnings season — the unwind of a 5-year gross leverage extreme is what takes us to the levels where a genuine bottom can form.
Energy CTA positioning tells the other side of the story. Crude oil CTAs are at their most long in years — the 94th-97th percentile. These are systematic trend-following strategies that are maximum long oil after one of the fastest commodity moves in decades. When the war premium eventually breaks, these positions unwind simultaneously and violently. The oil bear trade is already loaded — it just hasn’t triggered yet.
Bond positioning is at historic shorts across every major duration. One month ago, institutional bond positioning was at maximum long. Today it’s at maximum short. The fastest consensus reversal in the dataset. When rates reverse — and I believe they do when forced tightening into a weakening economy eventually tips into recession — the bond cover flow will be one of the most violent in years.
The institutional money that moved in Q1: energy stocks were bought aggressively and consistently. Airlines were sold aggressively. Financials were sold. Industrials saw their largest institutional selling in over five years. Software had shorts covered — not new longs added. This is the rotation I’ve been expecting. The data confirms it’s already underway.
How I’m Thinking About Positioning for Q2 and Beyond
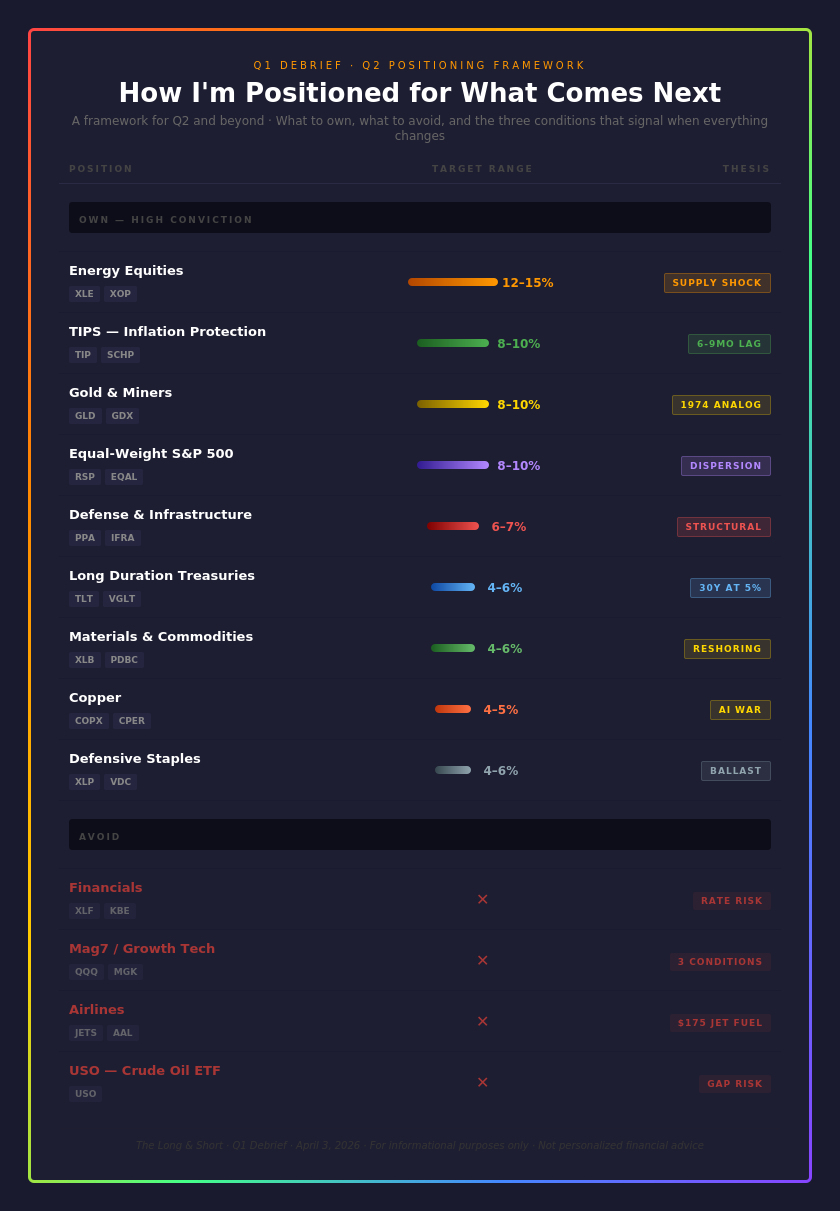
Let me be direct about my framework: I’m trying to own the supply side of the 1970s analog and avoid the demand side. Real assets over financial assets. Things that get more valuable when inflation is sticky over things that get hurt when rates stay high.
Energy equities — 12-15% of portfolio
ETFs: XLE (Energy Select Sector SPDR) · XOP (SPDR S&P Oil & Gas Exploration & Production)
Of all the positions in this framework, this is where I have the highest conviction. Not USO/Crude — and the reason is more important than most people realize.
The oil futures curve is currently in steep backwardation: the front month trades at $112 while the December contract trades near $72. That $40 gap is the market’s own estimate of the war premium — it’s pricing a full resolution of the supply disruption over the next several months. In a backwardated market, the roll actually works in USO’s favor month to month — it sells the expiring higher-priced contract and buys the next cheaper one.
But here’s the real problem with USO, and it’s the one that keeps me away from it entirely: when the war ends, it won’t end gradually. Oil doesn’t drift from $112 to $72 over six months. It gaps. A ceasefire announcement, a Hormuz reopening, a Trump Truth Social post — any one of those could take WTI Crude Oil from $112 to $70 in 24-72 hours. USO investors riding the front month contract get the full $40+ drop. A sophisticated investor who bought the December contract at $72 wouldn’t feel that move at all — they’re already priced for resolution.
USO’s prospectus requires it to operate on the front month. It has no choice. Investors who buy USO are not buying oil — they’re buying the war premium, fully exposed to the moment it evaporates. Energy equities have their own risks, but they don’t have this specific one. When oil falls from $112 to $70 on a ceasefire, XLE doesn’t fall 40%. The companies still have production, reserves, infrastructure, and dividends. The operating leverage works in both directions — but the asymmetry of a gap-down event is far more survivable in equities than in a front-month futures ETF.
When oil goes from $56 to $112, the profit margin of an oil producer doesn’t just grow — it explodes. The earnings re-rating hasn’t happened yet because companies haven’t reported Q1 results. That’s the catalyst I’m watching for in the next two weeks.
The refiner angle is one most investors overlook. Refiners like Valero (VLO) and Marathon Petroleum (MPC) don’t just benefit from high oil — they benefit from the spread between crude oil and refined products.
The national average diesel price hit $5.52 per gallon today — 30 cents below its all-time high. Every truck that moves goods across this country runs on diesel. Every farmer running equipment this spring runs on diesel. Every construction site runs on diesel. Refiners sit between the crude oil they buy and the diesel they sell — and at $5.52 at the pump, the margin between those two prices is running at approximately 2x its historical norm. That margin is their profit. It’s printing.
Jet fuel has gone from $100 to $175 per barrel. Airlines are paying it. Refiners are collecting it. More importantly: the refiner trade works even if WTI pulls back to $80, as long as the processing spread stays elevated. You don’t need oil to stay at $112. You need the gap between crude and refined products to stay wide — and with global refining capacity constrained, that gap isn’t closing anytime soon.
Gold and gold miners — 8-10% of portfolio
ETFs: GLD (SPDR Gold Shares) · GDX (VanEck Gold Miners)
The analog I keep returning to is 1974. Stagflation, supply shock, fiscal excess, geopolitical disruption — and gold was the best performing asset of the entire decade that followed. GLD is the direct expression. GDX adds the mining equity leverage — in the 1974 cycle, miners significantly outperformed physical gold.
The forced selling of gold through March — nine consecutive down sessions — looks to me like the end of institutional de-grossing, not the start of a bear market. The secular drivers are intact: fiscal excess, geopolitical commodity premiums, central bank diversification away from the dollar. When the tourist money finishes leaving, the structural buyers reassert.
SocGen’s technical work shows $5,415 as the primary target and $5,595 as the extended target. I think both are achievable if the stagflation thesis plays out as I expect.
Copper — 4-5% of portfolio
ETFs: COPX (Global X Copper Miners) · CPER (United States Copper Index)
Copper is the metal that wins every thesis simultaneously. Here’s why I like it: copper is required for defense buildout, electrification, reshoring, and AI infrastructure. Every theme that is winning in the current regime requires copper. And the technical setup is constructive — copper broke a key resistance level and has an institutional price target of 14,000-14,300 on the LME.
The forced selling of copper through March was mechanical institutional de-grossing, not fundamental selling. The thesis is intact.
TIPS — 8-10% of portfolio
ETFs: TIP (iShares TIPS Bond) · SCHP (Schwab U.S. TIPS)
The 6-9 month transmission timeline is the reason I think this trade is early, not late. Core inflation hasn’t yet reflected the oil move that happened in February and March. When it does — August through December — TIPS provides direct protection. And Liberation Day pharmaceutical tariffs add another inflation transmission mechanism on top of the oil passthrough.
Long duration Treasuries — 4-6% of portfolio
ETFs: TLT (iShares 20+ Year Treasury) · VGLT (Vanguard Long-Term Treasury)
The 30-year Treasury yield has been rising steadily since the war began. The level I’ve been watching as a buy signal — 5.00% on the 30-year — has become one of the most closely watched numbers in the market. And here’s what’s interesting: every time it has gotten within a few basis points of that level, a favorable announcement from the administration has pulled it back. That pattern has repeated multiple times. The 5% level is acting as a political floor — the administration understands what crossing it would signal, and has been managing against it.
That makes the setup more interesting, not less. The pressure building beneath that level is real. Institutional bond positioning is at a 5-year short extreme across every major duration — maximum short from a multi-year low base. The moment 5% breaks on a sustained closing basis — without an administration rescue — the institutional short-cover flow will be sudden and violent. I’m watching for the first clean close above 5% that doesn’t get walked back within 24 hours. That’s the entry signal.
Here’s what makes long-duration Treasuries worth positioning for now: it captures both tails simultaneously. If inflation wins near-term and rates push through 5%, that’s the institutional buy signal that activates the historically extreme short-cover. If forced tightening into a weakening economy eventually produces recession — and I think it does later this year — rates collapse and long-duration bonds rip from that higher level. This position is for the full arc, not a trade.
If you’re sitting in a money market or short-term Treasury fund right now, that’s fine — it’s earning real yield. This is simply where I think the higher-conviction opportunity develops as the year progresses. Start a position. Add on the 5% confirmation.
Defense and infrastructure — 6-7% of portfolio
ETFs: PPA (Invesco Aerospace & Defense) · IFRA (iShares U.S. Infrastructure)
The conflict has exposed NATO’s chronic underinvestment in defense spending. That spending increases regardless of how Iran resolves — governments don’t rebuild defense budgets and then cut them when a single conflict ends. Liberation Day tariffs make domestic infrastructure more valuable as import costs rise — when importing costs more, building domestically becomes relatively more attractive. Both themes work in the regime that exists regardless of what oil does next.
Equal-weight S&P 500 — 8-10% of portfolio
ETFs: RSP (Invesco S&P 500 Equal Weight) · EQAL (Pacer Equal Weight)
A standard S&P 500 index fund is approximately 33% Mag7 by weight. Equal-weight gives every company in the index the same representation — so Apple and a regional bank have identical impact on your return. In a dispersion regime — where some things are down 25% and others are up 25% simultaneously — equal-weight captures the breadth of what’s working without the concentration drag of what isn’t. It’s not a defensive position. It’s a smarter way to own the market when leadership is rotating rather than concentrated.
Materials and commodities — 4-6% of portfolio
ETFs: XLB (Materials Select Sector SPDR) · PDBC (Invesco Optimum Yield Diversified Commodity)
Copper, industrial metals, and broad commodities are the physical backbone of every reshoring, defense, and electrification theme simultaneously. The forced institutional selling of materials through March was mechanical de-grossing — funds reducing crowded positions — not a fundamental rejection of the thesis. COPX (copper miners specifically) is the sharpest expression of this if you want to go more targeted. XLB is the broader, more liquid expression.
Defensive staples — 4-6% of portfolio
ETFs: XLP (Consumer Staples Select Sector SPDR) · VDC (Vanguard Consumer Staples)
In a stair-step decline environment — where the market grinds lower with violent bear rallies — consumer staples provide ballast. People buy food, household products, and personal care items regardless of what oil does or what the Fed says. Staples won’t generate the returns of energy or gold in this regime. They’re the shock absorber in the portfolio. Own them for stability, not performance.
What I’m Avoiding — and Why
Financials— zero weight. The combination of rate uncertainty, credit concerns, and the stress visible in the bond market makes financials the most rate-sensitive sector in a rate-volatile regime. I exited this weight months ago and I’m not adding it back.
Mag7 re-entry — not yet as a group. Institutional tech positioning shows short exposure near its highest level in years. The March rally in tech was short covering, not new conviction buying. The re-entry signal I’m watching for across the group: oil convincingly below $95, rate volatility exhausted, and earnings revised down then beaten. None of those conditions are currently met.
That said — I’ll be transparent about one exception I’ve made. Microsoft is currently in its second-largest drawdown in the company’s history, and the longest duration drawdown on record. When MSFT was down 34% from its peak, I initiated a January LEAP position. Not because I think the macro has changed — it hasn’t. But a 34% drawdown over the longest stretch in Microsoft’s history on a company with Office 365, Azure, LinkedIn, GitHub, and the most durable enterprise moat in technology is a specific, data-driven, time-horizoned bet. That’s different from buying the Mag7 as a group at current levels.
The distinction matters: I’m not bullish on tech as a regime call. I made one name-specific contrarian bet at an extreme historical level with a defined time horizon. The broader re-entry for the group requires the three conditions above. One name at a historical extreme is a different decision entirely.
Airlines/Travel — the thesis that makes sense here is actually the short, not the long. Jet fuel is at $175 per barrel. The first full quarter of $100+ oil hasn’t hit airline earnings yet. When it does, the estimates that are still based on pre-war fuel costs are going to be revised sharply. The institutional money agrees — airlines were among the most aggressively sold positions in Q1.
For the 401k Investor — Finding Your Closest Expression
I know many of you are working within a limited menu. You may not have XOP or COPX available. Here’s how I’d think about mapping the thesis to what you have:
Energy exposure: Almost every 401k plan has an energy sector fund or a broad commodity fund. That’s your XLE equivalent. If you have a natural resources fund, even better — it likely includes energy, metals, and mining together.
Inflation protection: Look for a TIPS fund or inflation-protected bond fund. Most plans have one. This is your single most important addition if you have meaningful fixed income exposure in a world where oil nearly doubled in one quarter.
Gold: Many plans don’t have a direct gold option. The next best thing is a commodities fund or a real assets fund. Some plans include a precious metals option within a broader materials fund — check the underlying holdings.
Bonds: If your plan has a long-term Treasury fund or a total bond market fund, that’s your TLT equivalent. In a high-rate environment it’s uncomfortable to own — which is exactly when it’s most valuable to have it positioned for the rate reversal.
Reducing tech: If your plan’s large-cap growth fund is heavily Mag7-weighted — which most are — trimming that allocation and redirecting toward the above is the single most important portfolio decision you can make right now. Not eliminating it. Trimming it to a weight that reflects that a 40% market cap concentration is historically a peak, not a foundation.
The specific fund names don’t matter. The exposure does. Find the closest thing available to you and size it appropriately for your risk tolerance.
The Resolution Checklist
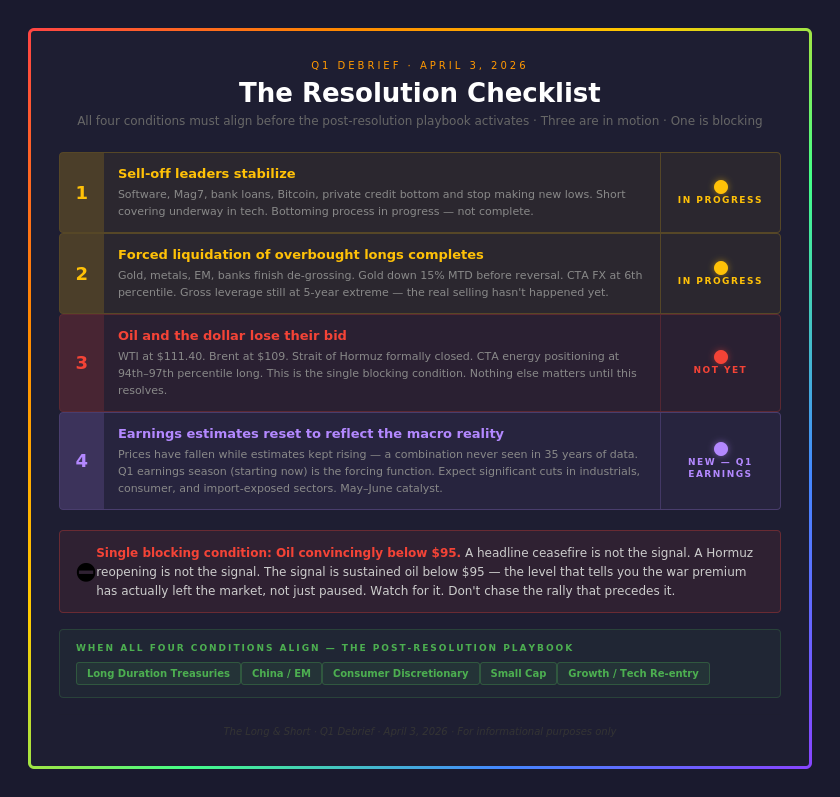
I’m watching three conditions simultaneously for the signal that the current regime is ending:
One: The sell-off leaders stabilize — tech, Mag7, private credit, bank loans bottom and stop making new lows. This is happening in fits and starts. Not complete.
Two: The forced institutional selling finishes — gold, metals, EM complete their de-grossing cycle. Getting close. Not complete.
Three: Oil and the dollar lose their bid. This is the one that isn’t happening yet. WTI at $111 with Brent at $109 and the Strait of Hormuz formally closed — the supply disruption is structural, not headline-driven. This is my single blocking condition for the correction being over.
A fourth condition has emerged post-Liberation Day: earnings estimates need to reset to reflect the macro reality. Prices have been falling while estimates kept rising — a combination that has never persisted for long in the historical data. Q1 earnings season is the forcing function. I expect significant estimate cuts across industrials, consumer discretionary, and any sector with meaningful import exposure. That process runs April through June.
When all four conditions align, the post-resolution playbook activates: long duration Treasuries, China, consumer discretionary, small cap. I’m not there yet. But I’m building the framework now so I’m not reacting when it happens — I’m executing a plan I already made.
The Bottom Line
One year ago, Liberation Day tariffs caused the worst single-day equity decline since 2022. The market recovered because the tariffs were eventually paused, struck down, and partially reversed.
This year, Liberation Day landed in a world where oil has nearly doubled, the Strait of Hormuz is closed, gross leverage is at a 5-year extreme, and earnings estimates haven’t yet adjusted to any of it.
The 1973-1974 analog I keep returning to has a specific lesson: the market bounced on the ceasefire. Then the worst of the decline followed. The market was slow to grasp what an oil shock actually meant for corporate earnings and consumer spending.
Q1 earnings season is where the market stops being slow.
Own the supply side. Reduce the demand side. Wait for the three conditions. Execute the plan when they align.
That’s how I’m thinking about it.
One last thought: this framework is a starting point, not a set-and-forget allocation. Oil moves. Yields move. The war resolves — or it doesn’t. When the conditions I described change, the positioning changes with them. I publish a paid weekly edition every Sunday that tracks exactly how this framework is evolving in real time — the specific levels I’m watching, what I’m adding or trimming, and what the data is telling me before it makes the headlines. At $20 a month, I’d like to think it’s among the better uses of that amount for anyone serious about not leaving money on the table.
The next update to this framework comes in Edition 8. Paid subscribers get it Sunday.
The Long & Short · Free Article · April 3, 2026
For informational and educational purposes only. This article represents my personal market analysis and is not personalized financial advice. All investments involve risk. The ETFs referenced are illustrations of market exposure, not specific recommendations. Please consult a qualified financial professional regarding your specific situation.