
Maximum Compression
The worst Mag7 drawdown in history. The most loaded mechanical setup of the year. Tuesday resolves both.

The Long & Short — Edition 7 | Week of March 23–27, 2026
Markets · Planning · Perspective
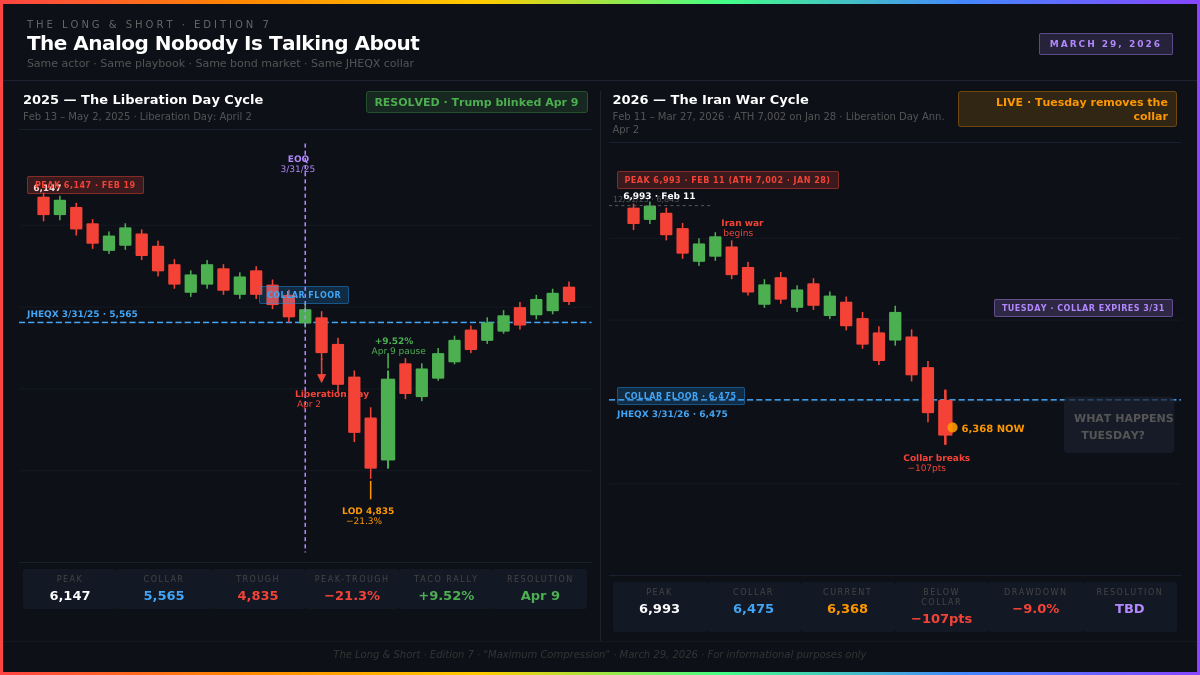
Pull up the SPX chart from February through May of 2025.
Same actor. Same playbook. Truth Social posts with contradicting signals from the other side. An economy that looks like it’s coming apart at the seams. A Fed that can’t move. TLT in freefall. Mag7 in a bear market. The crowd convinced it only gets worse from here.
That was the Liberation Day cycle. It ended on April 9, 2025 when Trump watched the bond market signal something close to crisis and announced a 90-day pause. SPY rallied 9.52% in a single session — the largest one-day gain since 2008. The JHEQX collar had expired nine days earlier at 5,565. SPX had closed the Friday before expiry at 5,580 — just 15 points above the strike. Expiry day flushed to 5,488, reversed 127 points, closed at 5,615. The two sessions following added another 80 points. Total move from the expiry day low: 207 points.
This Tuesday, March 31, the JHEQX collar expires at 6,475. SPX closed Friday at 6,368 — already 107 points below the strike. The dealer delta-selling that turned the floor into a trapdoor has been running for two sessions. The flush may already be in progress. And this Thursday is the one-year anniversary of Liberation Day.
Same movie. The question is whether we’re in the crash or the pause.
Everything that follows is the data behind that question.
The Machine
There is a category of market participant that does not read headlines. It does not watch oil prices or ceasefire negotiations or Powell press conferences. It runs a mathematical model that says: when volatility rises, reduce exposure. When drawdowns accumulate, reduce exposure. When trailing realized volatility exceeds its target, reduce exposure.
This is Vol Control. This week it shed $33.6 billion in US equity exposure — the 5th percentile of all weekly flows in its history. Over the past month it has removed $52.3 billion. At Friday’s −1.67% SPX session, the implied notional sell from Vol Control alone was $16.8 billion. In a single session. Automatically. The model does not care that CTA positioning is at the 2nd percentile. It does not care that VRP is at the 100th percentile. It sells because the math says sell.
Then there is Risk Parity. It operates on the longest lookback window of any systematic strategy — which makes it the last to move and the most persistent seller once it starts. The critical insight from this week’s institutional research: volatility does not have to increase from here to generate substantial additional deleveraging flows. The trailing realized volatility is still averaging up along the way after a prior sustained multi-year low-vol period. The leverage that was accumulated over two years of calm is still being returned. At 100% of crisis vol levels, Risk Parity projects $23.5 billion in additional bond deleveraging over the next month. At 75% of crisis vol — if things calm down — it still projects $8.8 billion.
The machine runs regardless of what happens in the Strait of Hormuz.
Then there are the CTAs. Every major macro asset except energy is at or near historical shorts simultaneously. The E-Mini S&P: 2nd percentile, Z-score −2.77. The Nasdaq: 2nd percentile, Z-score −2.84. The 10-Year T-Note: 2nd percentile, Z-score −2.57. The 30-Year Treasury: 2nd percentile, Z-score −2.80. Gold: 10th percentile, Z-score −1.68.
One month ago, the 20-Year and 30-Year Treasury CTAs were at +100 — maximum long. Today they are at −100 — maximum short. One of the fastest consensus reversals in the dataset. When rates reverse — and Hartnett’s 30-Year at 5% tripwire is nine basis points away — the CTA cover flows will be simultaneous and violent.
The only long position in the CTA book: Brent crude at the 96th percentile.
The only catalyst needed to unwind the entire complex: oil loses its bid.
The Worst Two Days in Mag7 History
Thursday and Friday were the worst two consecutive sessions in the history of the Magnificent 7. Not the worst two days of 2026. The worst two days ever recorded for this group of seven companies.
The average drawdown across all seven names from their respective highs: **−24.7%**. Six of seven are in bear markets. Not one is within 10% of its all-time high.
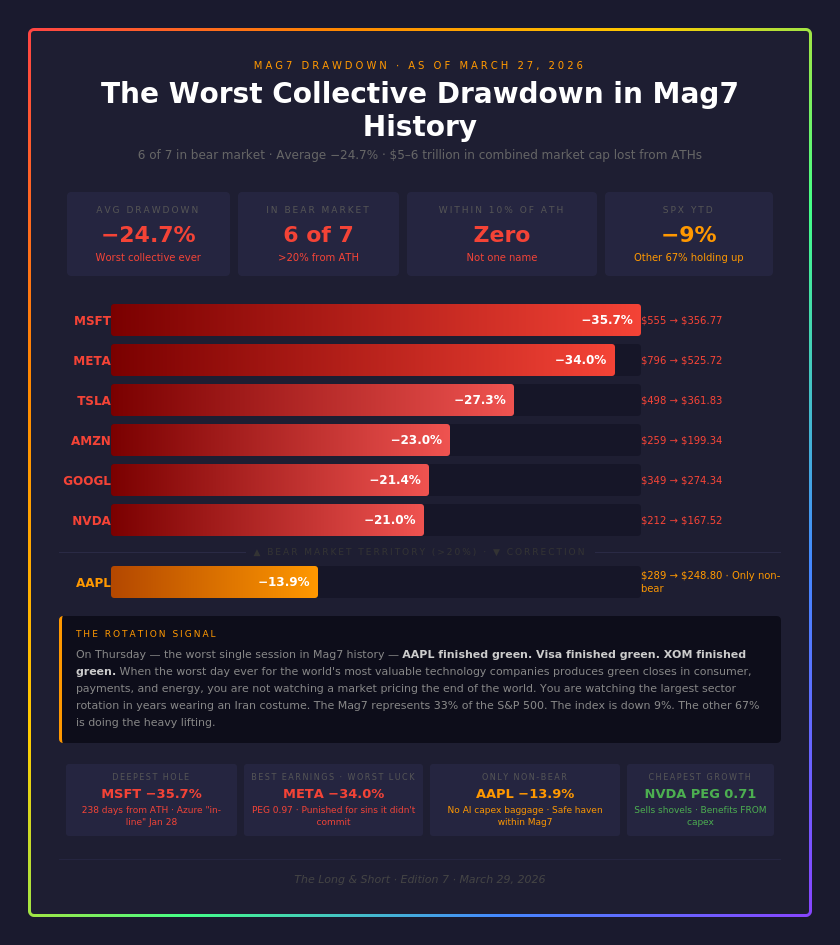
The Mag7 represents 33% of the S&P 500. The index is down 9% from its highs. The math tells you everything: the other 67% of the market is doing the heavy lifting. This is not broad liquidation. It is the largest sector rotation in years wearing an Iran costume.
The tell came on Thursday. The Mag7 recorded its worst single session ever — and AAPL finished green. Visa finished green. XOM finished green. When the worst single day in Mag7 history produces green closes in consumer, payments, and energy — you are not watching a market that is pricing the end of the world. You are watching a market that has decided, with considerable conviction, what the next regime looks like.
The story of this selloff has two distinct acts. Act One began on January 28 when Microsoft reported Azure growth “in-line.” Not bad. Not great. But for a stock priced for AI dominance, “in-line” was a verdict. The seed of doubt was planted. Then Google reported $91.4 billion in full-year 2025 capex — and guided 2026 toward $175-185 billion. Then Amazon confirmed with $131.8 billion in 2025 capex, guiding toward $200 billion in 2026. The market asked one question — what is the return on all this spending — and got no satisfying answer. The Mag7 went from peak to correction before the first shot was fired in the Strait of Hormuz.
Act Two is Iran. What was already wounded became wrecked.
The combined market cap lost from these seven names from their respective highs: approximately $5-6 trillion.
Yet the SPX is only down 9%.
The pendulum is stretched to extremes. The rubber bands are at maximum tension. The question, as always, is not whether they snap back — it is when.
